Here is a sample spreadsheet with the pivot table already set up. If desired, download it and paste in your own data.
Note to Windows/Internet Explorer users: If clicking on the sample spreadsheet link opens the file without giving you the option to save it, try right-clicking on the link and choose Save Target As . . ..
Note to Mac Users: For more specific directions about using Excel on the Mac to calculate GPAs, please see How do I calculate a departmental GPA? I’m using a Mac.
Overview
Departmental GPA or major GPA is really a special GPA. That is, it’s a GPA calculated using only the grade credits earned and hours earned in certain classes. For most, this means all the classes in a particular subject area (like psychology or journalism). For others, it’s more complicated. For example, International Studies majors calculate the major GPA based on certain classes that belong to many different subject areas.
Either way, it’s important that you clearly define what classes will count towards this special GPA before you begin.
Calculating the departmental or major GPA can be broken down into three overall steps.
Step 1: Download student grade data into a spreadsheet.
Step 2: Summarize the data and calculate the GPA using a pivot table.
Step 3: Limit the GPA calculation to the subject area or classes you want.
Step 1: Download student grade data into a spreadsheet.
- Click the Query Viewer link under CS Tools. The Query Viewer page appears.
- Enter part of the query’s name (BU_SR_XSCRIPT_DATA) and click the Search button . A list of queries that match your search criteria will appear at the bottom. Any query that starts with BU_SR_XSCRIPT_DATA will work; pick the one which best fits the population you want to select. Click the Excel link to run the query.
- A new query window will open. Enter the Academic Institution: BUTLR, the Academic Plan code (major) of the student (use a % to capture secondary majors, Bas and BSs, etc.) and enter the current term. (A 4-digit code for the semester, e.g.: 4063 = Spring 2007, 4071 = Fall 2007, 4073 = Spring 2008.) If the query requests an ID number, enter the student¦s 9-digit campus ID.
- Click the View Results button.
- Save the file to a convenient location by clicking Save in the ‘File Download’ window that opens. Then select a location and name the file. Click Save.
- Using Windows Explorer, navigate to the file you’ve just saved and double click on it to open it in Excel.
Step 2: Summarize the data and calculate the GPA using a pivot table in MS-Excel
Note: Here is a sample spreadsheet with the pivot table already set up. If desired, download it and paste in your own data.
[Note: If clicking on the sample spreadsheet link opens the file without giving you the option to save it, try right-clicking on the link and choose Save Target As . . ..]
- Click the Insert menu, choose PivotTable and PivotChart Report. A pivot table wizard window appears, and Excel selects a portion of the datasheet for pivot table analysis. Select the radio button option that indicates where you’d like your pivot table to be placed (such as in a new worksheet) and click the OK button.
- The wizard finds your data. Click the Next button.
- Drag and drop the little boxes on the PivotTable Field List border in the upper right into the filter areas on the lower right so that the border looks like the picture below, then click OK and click Finish.
Tip: If the PivotTable Field List isn’t visible on the right of your screen, then click on the Options main menu choice, then look for the Field List button on the Show/Hide section of the ribbon.
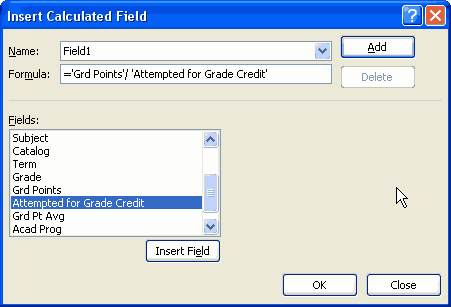
- Next, you’ll insert the calculated field that will divide Grd Points by Attempted for Grade Creditand yield the GPA.
- Click inside cell D5 to put the focus there.
- Click the Options menu and choose Formulas > Calculated Field.
- In the “Fields” box, click on the “Grd Points” item and then click the Insert Field button.
- In the “Formula” field, enter a “/”.
- In the “Fields” box, click on “Attempted for Grade Credit” item and then click the Insert Field button.
- Your window should look like the one below. If so, click the Add button at the top and then click the OK button at the bottom.

- Next, click inside the first cell that contains “Sum of Field 1” and type “GPA.” Press the tab key to move out of the field and “GPA” replace all the “Sum of Field 1.”
Step 3: Limit the GPA calculation to the subject area or classes you want.
Here’s the fun part – use the pivot table’s features to limit which classes are used to calculate the GPA. Depending on your scenario, follow the steps below:
Scenario 1: If all the classes in only one subject area count, click the subject drop-down list in cell A1 at the top of the spreadsheet and choose the desired subject area code. (SP in the example image). The pivot table filters out all other subject areas and thus only calculates the GPA for classes in Spanish.
Scenario 2: Only certain classes count and the subject areas vary: click the drop-down list for the “Subject Area & Catalog Number” column and uncheck the boxes next to the classes that don’t count toward the special GPA. Then click OK. For example, if SP 102 and 103 did not count towards this special GPA, you can only check the boxes next to the classes that do count thereby calculating a GPA based on a set of classes that you determine.
